EUR/JPY Price Analysis: Traders eye downside support levels after a failure to break the previous wave high
- EUR/JPY is still trading just above flat for the session on Thursday.
- There has been some selling pressure in the last hour or so.
EUR/JPY 1-hour chart
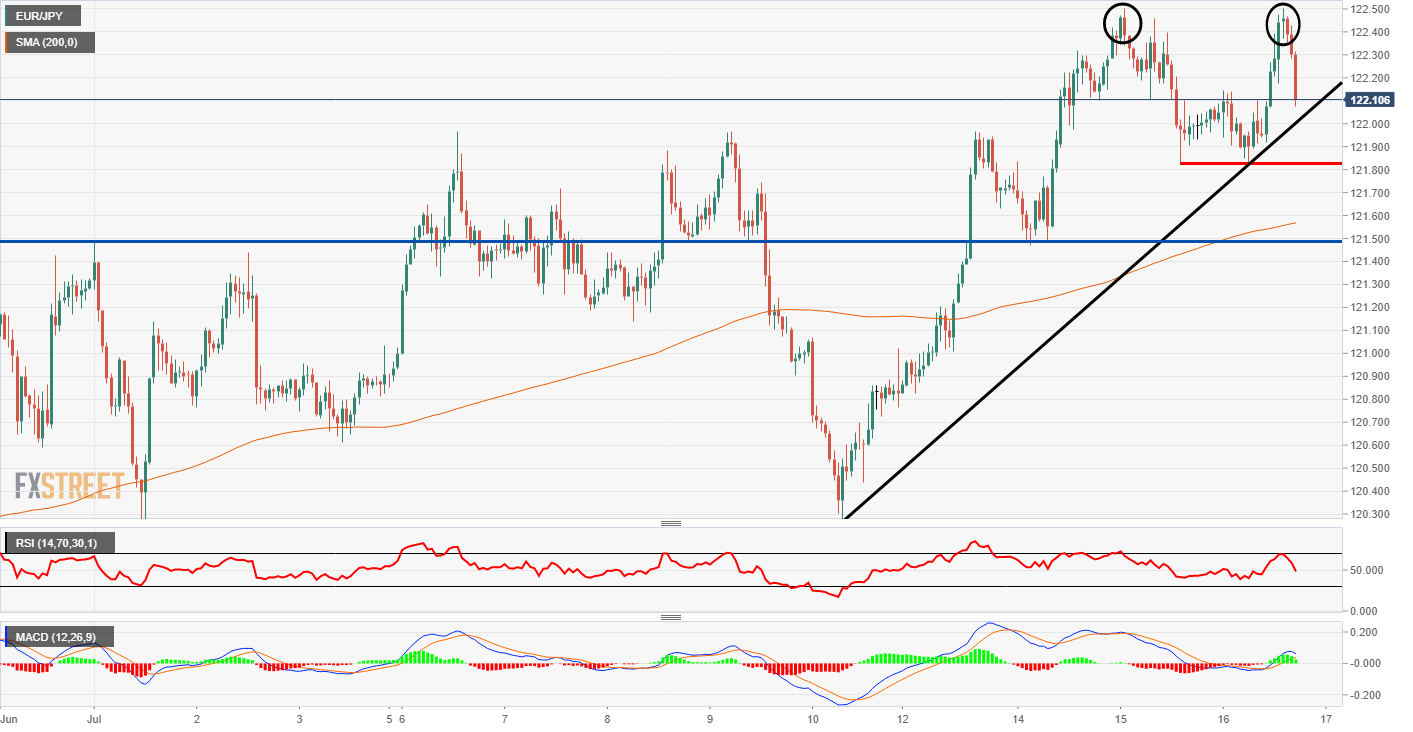
EUR/JPY has been very positive for most of the session but in the last few hours, the price action has switched to the downside. The catalyst could have been a rejection of the previous wave high at 122.50. There could have been a bank of sell orders at the level but nevertheless the bulls could not break the resistance.
On the downside, there are some key levels close to the current price. The next support is at the red line at 121.83, A break of this level would make a new wave low and could indicate a trade change might be taking place. Another interesting support could be the black trendline and a break there could be first up before the test of the red support zone.
The Relative Strength Index has just recently turned bearish, the indicator is about to attack the 50 level and a break is a bearish signal. The MACD is still positive for now, the histogram is still in the green but the bars are getting smaller. The signal lines are still just about above the mid-zone which is still bullish but they do lag behind the price. On the daily chart, there was a rejection of the highs yesterday too and if it happens once again today it would confirm that bearishness.
Additional levels