AUD/USD Price Analysis: Off intraday high but stays above 200-HMA
- AUD/USD recedes from 0.6985 in the latest pullback moves.
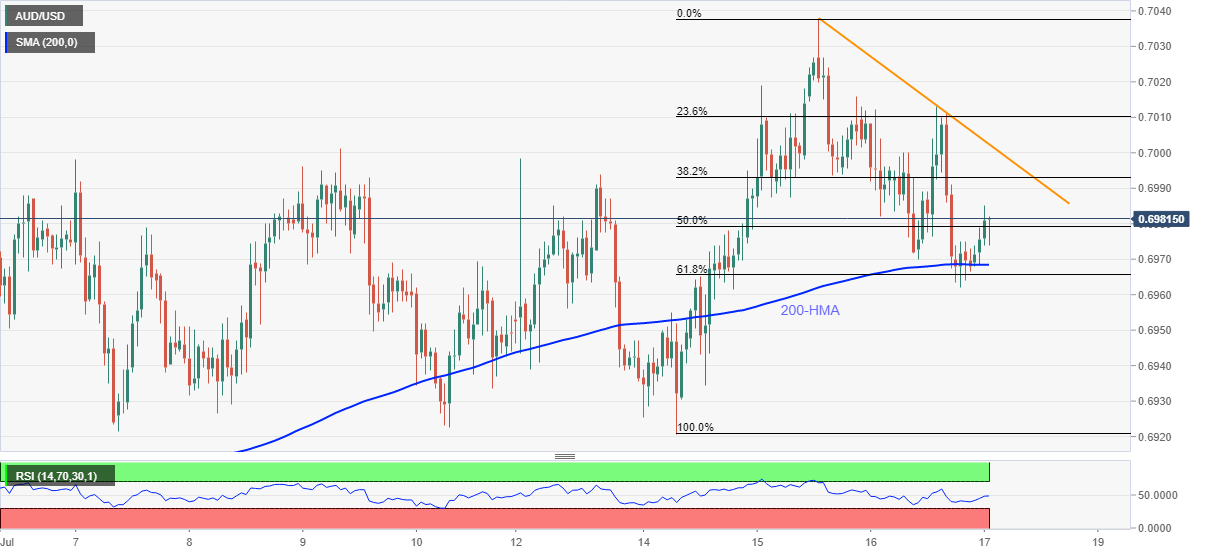
- 200-HMA, 61.8% Fibonacci retracement guards immediate downside.
- A two-day-old falling trend line restricts short-term advances.
AUD/USD eases to 0.6978, up 0.15% on a day, during Friday’s Asian session. The aussie pair seems to fade the upside momentum despite carrying its pullback moves from 61.8% Fibonacci retracement of July 14-15 upside and 200-HMA.
Though, bears will wait for entries unless the AUD/USD prices refresh the daily low of 0.6962. In doing so, the quote will have to break the key moving average and stated the Fibonacci retracement level around 0.6970/65.
If at all sellers tighten their grip past-0.6960, the odds of the pair’s declines to the monthly low near 0.6925 and then to 0.6900 round-figures can’t be ruled out.
On the flip side, the quote’s further recoveries will have to cross the immediate resistance line, at 0.7003, to challenge Wednesday’s peak, also the highest in the month, around 0.7040.
During the pair’s sustained rise above 0.7040, the June month peak surrounding 0.7065 and 0.7100 threshold can lure the bulls.
AUD/USD hourly chart
Trend: Bullish