USD/CAD Price Analysis: Bears attack 1.3300 to visit five-month-old support line
- USD/CAD prints three-day losing streak, nears the lowest since February 26.
- Sustained trading below 61.8% Fibonacci retracement, bearish MACD favor sellers.
- 21-day EMA offers immediate upside barrier before the 1.3485/95 area.
USD/CAD remains on the back-foot while declining to 1.3300 amid the early Asian session on Wednesday. In doing so, the loonie pair takes rounds to late-February low. Failures to cross 21-day EMA and sustained trading under 61.8% Fibonacci retracement of December 2019 to March 2020 upside suggest further weakness of the quote.
As a result, a downward sloping trend line from March 09, at 1.3193 now, gains the market’s attention. Though, bears will have to keep the reins past-1.3300 to revisit the key support line.
In a case USD/CAD prices drop below 1.3193, odds of witnessing 1.3000 psychological magnet on the chart can’t be ruled out.
Alternatively, 21-day EMA close to 1.3440 becomes the immediate resistance for the pair ahead of an area comprising lows marked on June 23 and the early-July, around 1.3485/95.
It’s worth mentioning that the quote’s rise past-1.3495, targeting 61.8% Fibonacci retracement level of 1.3600, depends on how well the bulls command above 1.3500 round-figure.
USD/CAD daily chart
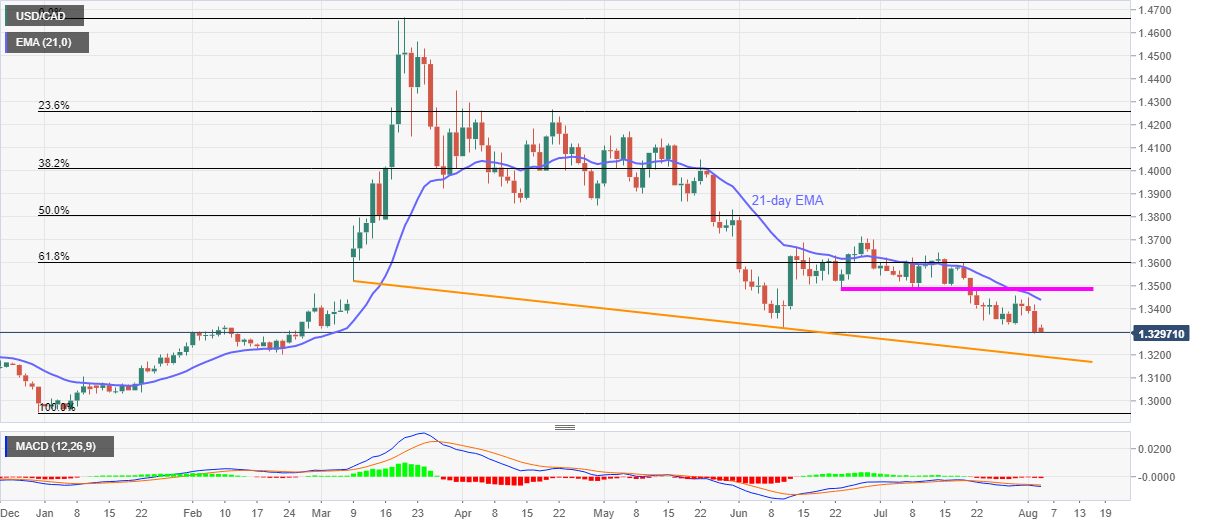
Trend: Bearish