Back
3 Feb 2021
GBP/USD Price Analysis: Weekly chart signals indecision, 1.36 is crucial support
- GBP/USD's weekly chart shows indecision and bull fatigue.
- A close below 1.36 woukld imply a temporary reversal lower.
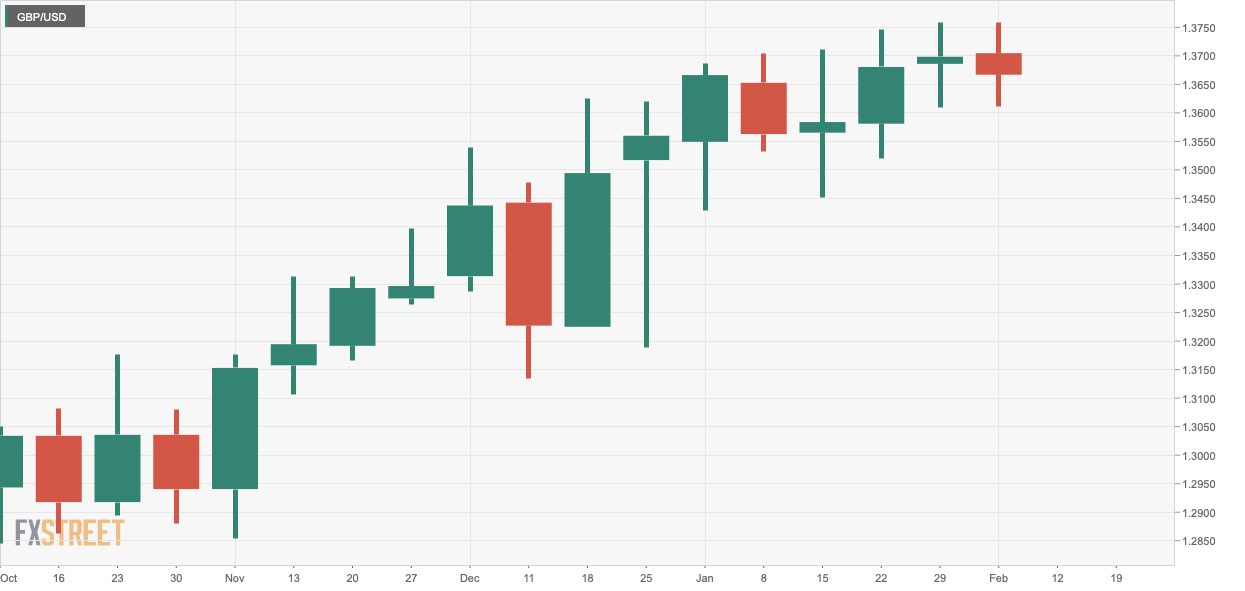
The GBP/USD market looks to have turned indecisive.
The long upper and lower wicks attached to the current and the preceding weekly candle indicate both bulls and the bears are unwilling to lead the price action.
These candles also imply bull fatigue, given they have appeared following a solid rally from 1.28 to 1.38.
As such, the immediate bullish bias stands neutralized. If the pair finds acceptance under 1.36 – the level defended since last week – the bull fatigue signaled by the weekly candles would gain credence, and a more substantial selling pressure may be seen.
On the higher side, the weekly high of 1.3758 is the level to beat for the bulls.
Weekly chart
Trend: Neutral, bull fatigue
Technical levels