Silver Price Analysis: 100-EMA on H4 continues to cap the upside for XAG/USD
- Silver continued with its struggle to break through the 100-period EMA on the 4-hourly chart.
- Mixed oscillators on 4-hourly/daily charts warrant some caution before placing directional bets.
Silver struggled to capitalize on the previous day's positive move and edged lower during the Asian session on Tuesday, albeit lacked any strong follow-through selling. The commodity was last seen trading near the $26.15 region, down around 0.15% for the day.
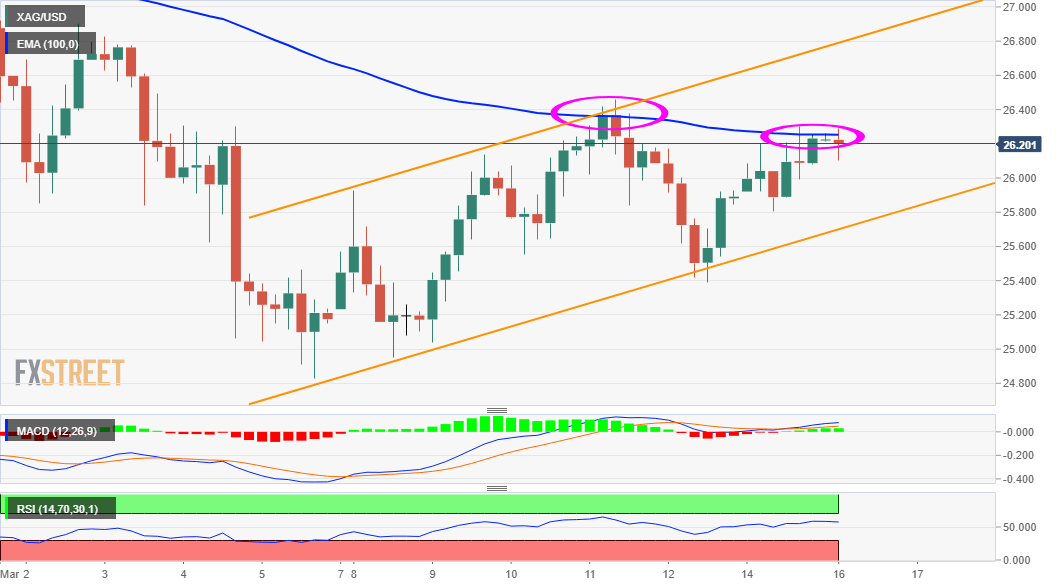
From a technical perspective, the XAG/USD has repeated failed to breakthrough the 100-period EMA on the 4-hourly chart. The mentioned hurdle is pegged near the $26.25-30 region, which should now act as a key pivotal point and help determine the near-term trajectory.
Meanwhile, technical indicators on the said chart have just started moving into the positive territory but are yet to confirm a bullish bias on the daily chart. This, in turn, warrants some caution for aggressive traders and before positioning for any firm direction.
Looking at a slightly broader picture, the recent bounce from multi-week lows, around the $24.85-80 region has been along an upward sloping channel. Given the recent sharp pullback, the channel seemed to constitute the formation of a bearish flag chart pattern.
That said, a sustained strength beyond the $26.25-30 region might push the XAG/USD towards the trend-channel resistance, around the $26.85-90 region. This coincides with monthly swing highs, which if cleared will be seen as a fresh trigger for bullish traders.
On the flip side, any meaningful slide below the $26.00 mark might continue to find decent support near the lower boundary of the channel currently near the $25.85 region. A sustained break below will confirm a bearish breakdown and pave the way for a further downside.
The XAG/USD might then accelerate the fall towards the key $25.00 psychological mark. The downward momentum could get extended and drag the commodity to the very important 200-day SMA, around the $24.00 area, with some intermediate support near the $25.55-50 region.
XAG/USD 4-hourly chart
Technical levels to watch