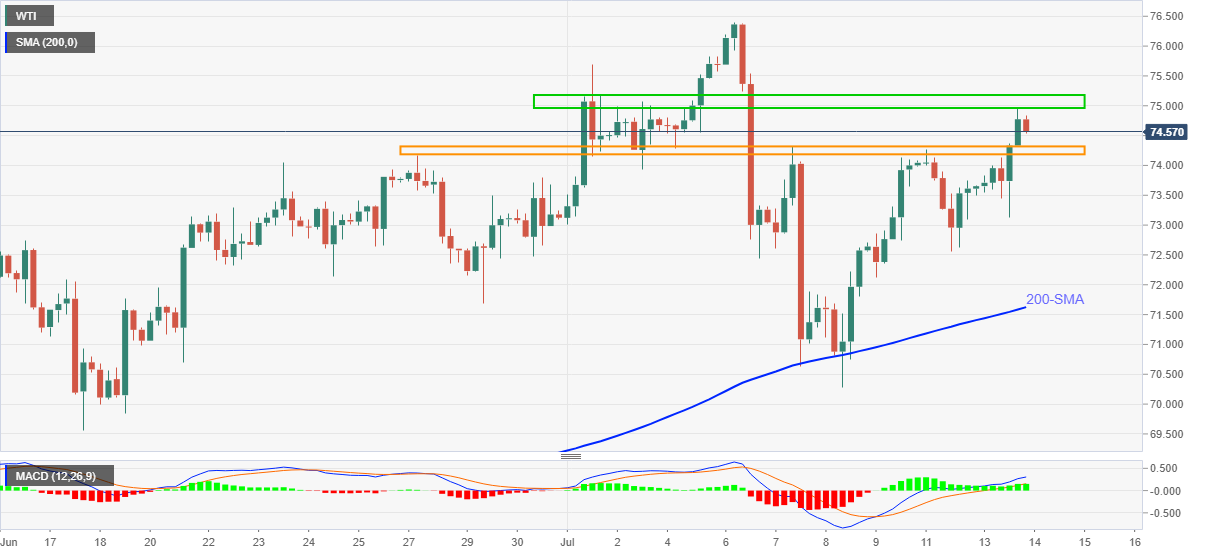
WTI Price Analysis: Consolidates gains around $74.50 post API inventories
- WTI pulls back from one-week high on weaker-than-previous draw in weekly API stockpile.
- Bullish MACD, sustained trading beyond 200-SMA back buyers to battle monthly horizontal hurdle.
- 12-day-old support region lures intraday sellers, further downside has a bumpy road to the south.
WTI retreats to $74.58, down 0.17% intraday, amid the early Asian session trading on Wednesday. In doing so, the oil benchmark steps back from a one-week high, flashed the previous day, on soft inventory draw, per industry reports.
Weekly Crude Oil Stocks data from the American Petroleum Institute (API) reports -4.079M of inventories, versus -7.983M prior, for the week ended on July 09.
The weaker than the previous draw in stockpiles allowed bulls to take a breather from a two-week-long horizontal area surrounding $75.00–75.20.
Even so, the corrective declines remain less destructive to even the short-term uptrend until the quote stays beyond the $74.30–20 zone, comprising multiple levels marked since June 28.
In a case where the oil sellers break $74.20 support, the $74.00 threshold and the weekly bottom close to $72.55 will test the further downside ahead of highlighting the 200-SMA level of $71.62 for the WTI bears.
It’s worth noting that the bullish MACD can keep energy buyers hopeful should the prices remain above the key SMA, a break of which will challenge the monthly low close to $70.30.
Meanwhile, an upside clearance of $75.20 will direct WTI bulls to the multi-month high of $76.40, marked last week. However, any further advances will be tested by the year 2018 top of $76.80.
WTI: Four-hour chart

Trend: Bullish
