WTI Price Analysis: Bulls seek clear break of $72.00
- WTI remains mildly bid, seesaws around five-week-old resistance line.
- Bullish MACD, sustained trading beyond 100-SMA keeps buyers hopeful.
- 200-SMA, 61.8% Fibonacci retracement level will lure the bulls past $72.00.
WTI bulls attack a short-term key resistance around $71.90, up 0.10% intraday, during early Friday.
The black pierced the stated hurdle late Thursday but failed to provide a closing break, which in turn highlights the need for a clear run-up beyond $72.00.
That said, bullish MACD signals and the commodity’s ability to stay beyond 100-SMA hints at the quote’s further upside.
In doing so, the 200-SMA level of $74.95 and the 61.8% Fibonacci retracement level of early November-December fall, around $75.50, will be on the WTI bull’s radar.
Should the energy benchmark rises past $75.50, the late November’s swing high around $79.00 and the $80.00 threshold, will be in focus.
Alternatively, a downside break of 100-SMA level of $70.60, will defy the bullish bias and direct the quote towards the monthly horizontal support near $69.20-05.
Following that, $65.50 may offer an intermediate halt before directing the WTI bears towards the monthly low of $62.34.
WTI: Four-hour chart
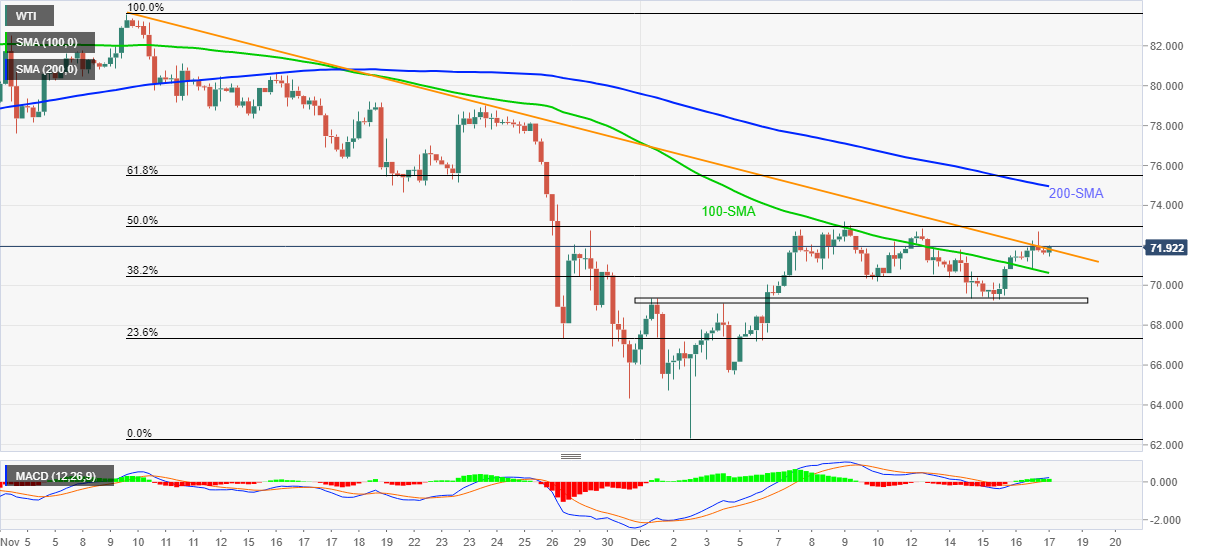
Trend: Further upside expected